Out of This World Performance!
Trend Analysis
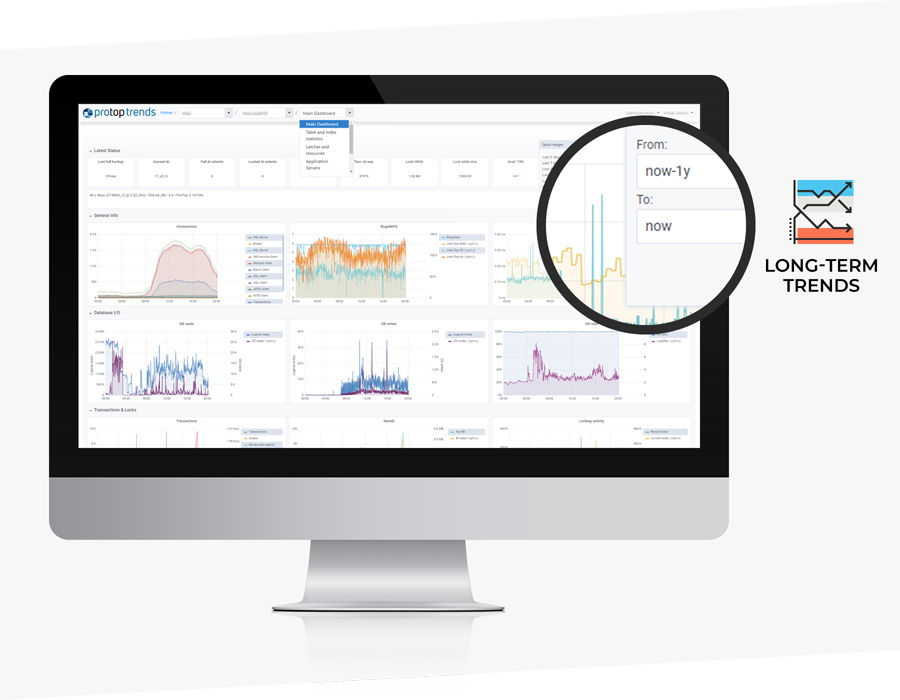
The Trends dashboard allows you to visualize changes over weeks and months or alternately zoom in to the minutes when a problem was affecting your business.
Whether you need to monitor one database on one server or hundreds of databases, AppServers, WebSpeed, Tomcat and other resources spread around the world, the ProTop dashboard gives you real-time visibility into the state of your business-critical application components.
We’ve combined our 30 years of experience with data from widely scattered sources to give you actionable information and alerts in one coordinated and insightful view.
Actionable Information
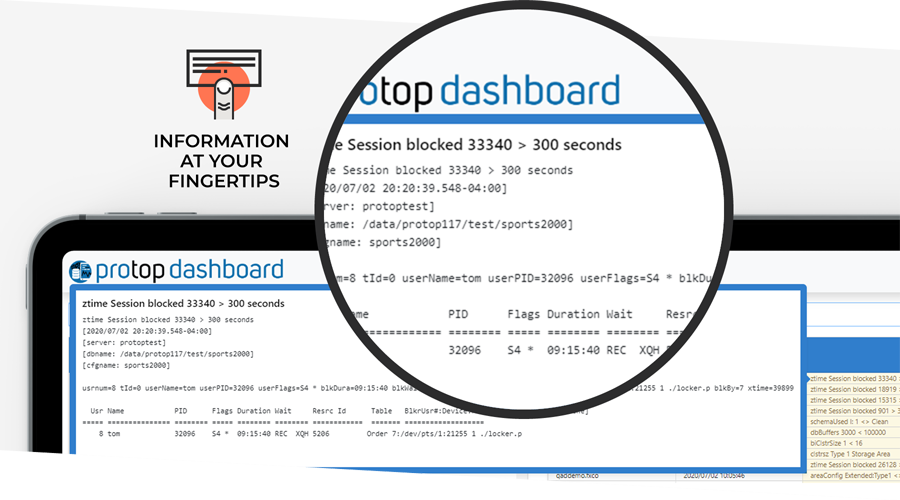
Get actionable information at your fingertips.
ProTop automatically gathers the information you need to respond to a business-critical interruption. Resolve issues quickly rather than wasting time digging for data.
Ease of Use is Built In
Access ProTop from any device. Anywhere. Anytime.
Easily access the ProTop dashboard using any device. At work, at home or on the road, the status of your Progress environment is never more than a click away.
-
Trend Viewer
-
Customised Alerts
-
Actionable Information
-
Use On Any Device
-
Colour Coded
Intuitive Dashboard
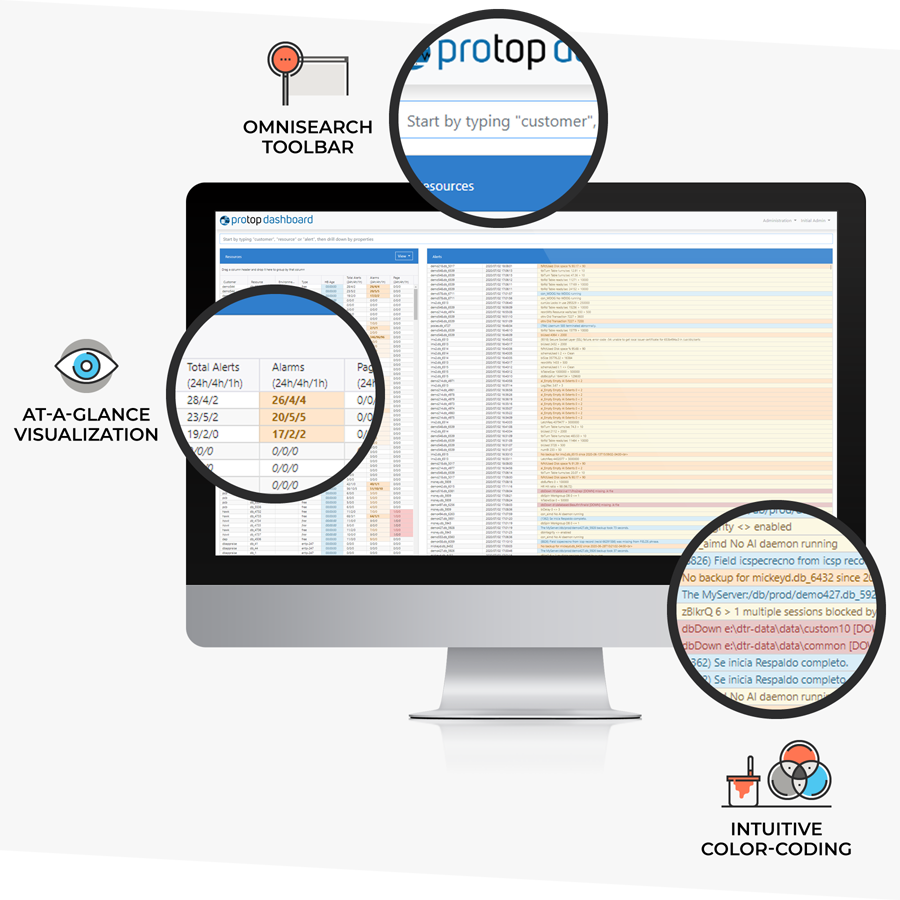
Our colour-coded web and mobile dashboards give you an instant, at-a-glance view of the status of your monitored resources.
Whether you need to monitor one database on one server or hundreds of databases, AppServers, WebSpeed, Tomcat and other resources spread around the world, the ProTop dashboard gives you real-time visibility into the state of your business-critical application components.
We’ve combined our 30 years of experience with data from widely scattered sources to give you actionable information and alerts in one coordinated and insightful view.
Customizable Alerts
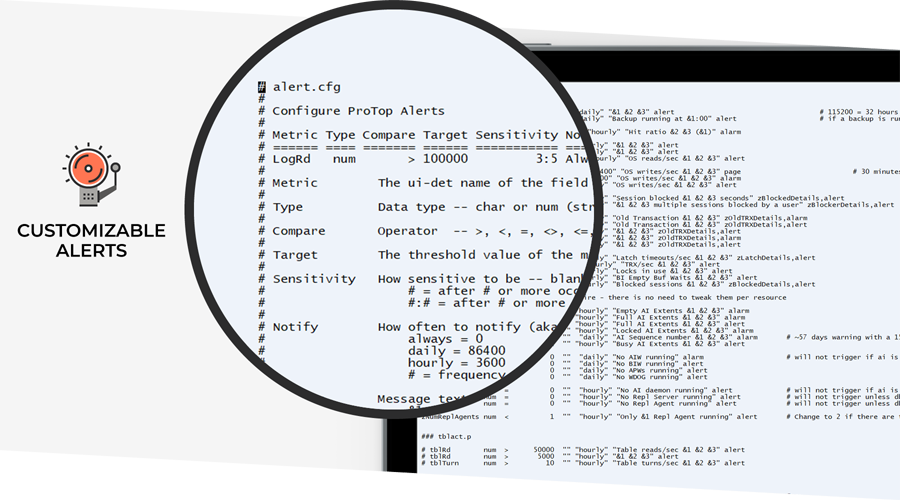
Alert configuration is fast, easy and flexible.
Set one alert level or escalate with multiple thresholds associated with different severity levels. Keep the noise level to a minimum with custom nag intervals. Scriptable actions allow you to automate responses.critical application components. We’ve combined our 30 years of experience with data from widely scattered sources to give you actionable information and alerts in one coordinated and insightful view.
Use On Any Device
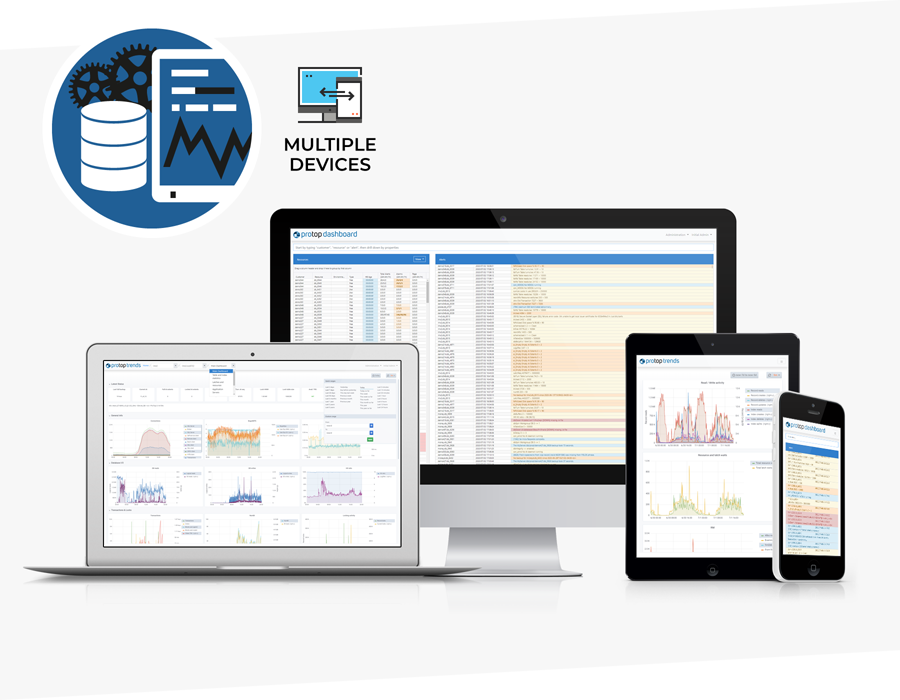
Access ProTop from any device. Anywhere. Anytime.
Easily access the ProTop dashboard using any device. At work, at home or on the road, the status of your Progress environment is never more than a click away.
